Comparison of NEDC, EPA and WLTP cycles
Providing an accurate estimate for the range of electric vehicle is a next to impossible task. There are just too many variables that affect the electricity consumption of a vehicle and consequently its range.
For years the ICE car owners had mostly accepted the fact that the announced fuel consumption of the cars was a bit off. Recently though, new more thorough test cycles have been proposed and implemented that aim to reflect reality better. But which one is the most trustworthy? The less than conclusive answer is "It depends". So we now set off to examine the most popular test cycles and see who they are for.
 WLTP range testing cycle
EPA cycle
First of all, it has to be clarified that the EPA test cycle used in the US is a dynamometer concept cycle. That means that the car is tested on a dyno and not on the real road. So, how does this cycle work?
There are two estimates in this cycle, the urban estimate represented by the UDDS (Urban Dynamometer Driving Schedule) and the highway estimate represented by the HWFET (Highway Fuel Economy Test).
Before the testing procedure begins, the car is fully charged and left on its own for the night. When the testing begins, continuous UDDS and HWFET cycles are performed until the battery is totally depleted with a mix of 55% HWFET and 45% UDDS.
Then the car is fully charged using a precise meter on the plug to determine the kWh drawn from the grid. In this way, the on-board charger efficiency is also taken into account. Because this is a lab test, a correction factor is applied to the results to better simulate real life. This correction factor ranges between 0 and 1 and depends on the number of drive cycles the car was tested for.
If a car in the HWFET schedule acheives a range of 100 miles and its relevant correction factor is 0.8, then the official range is 80 miles. In general, we could say the EPA cycle appears to be the most strict of the currently used cycles. It has to be mentioned though that EPA is not consistent across all electric vehicles, though.
For example, Porsche Taycan’s EPA range is barely over 200 miles while owners and car tests indicate that the car is capable of going at least 25% longer. The opposite happens with Tesla Model S, which normally can't get near its official EPA rating because of the adjustment factor that Tesla uses for its model which is based on a different interpretation of the SAE J1634 standard.
 EPA low and high speed cycles
NEDC cycle
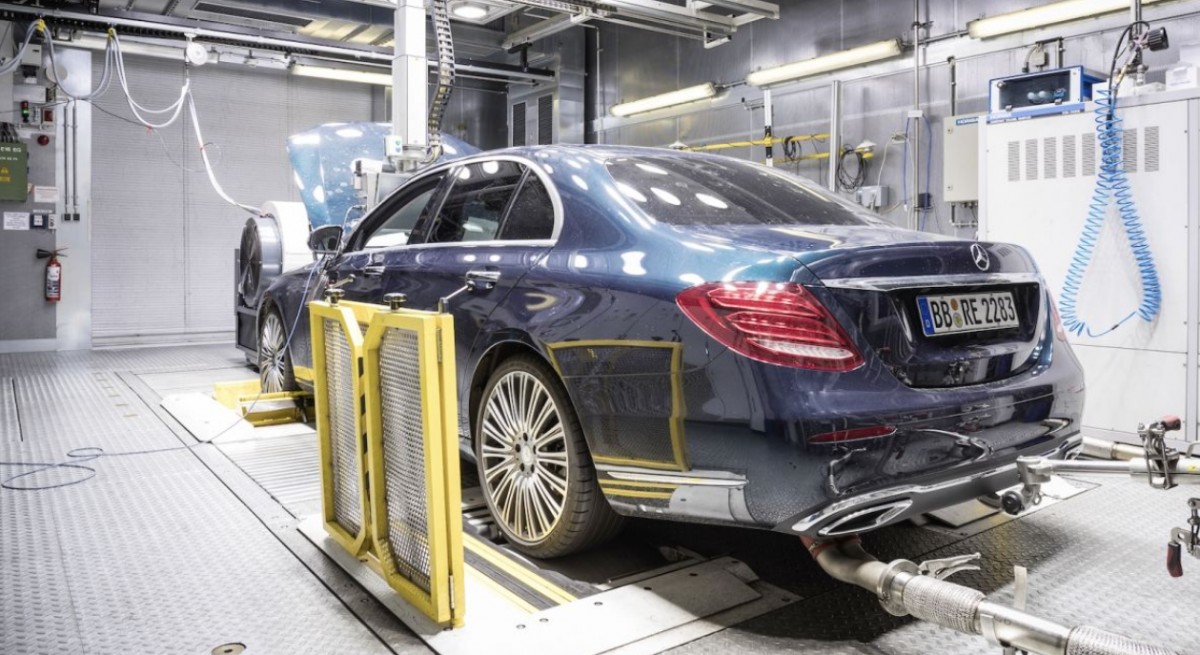
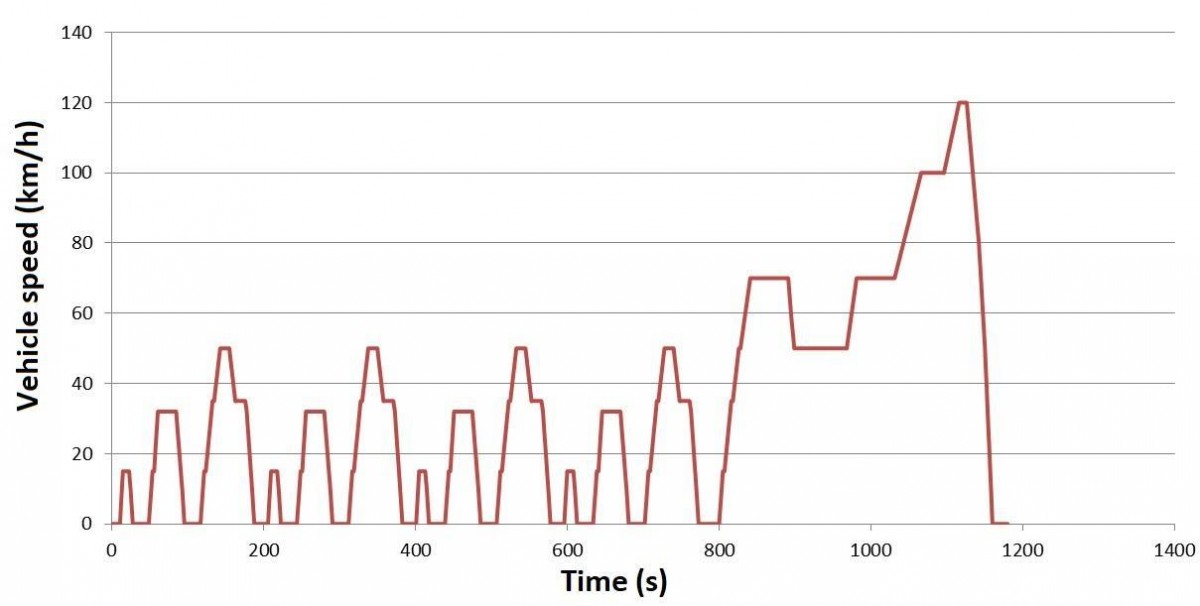
The NEDC (New European Driving Cycle) was used from the 80s up until September of 2017. As in the EPA cycle, the car is tested in a lab and got two estimates, the urban estimate represented by the ECE-R15 subcycle and the highway estimate represented by the EUDC subcycle.
The mix of the two phases is 66% urban driving and 34% highway driving while the simulated distance is 11 km and driving time is 20 minutes. No climate system and electric auxiliaries are used in this cycle and there is no influence of the optional equipment in the results.
The average speed in this cycle is 34 km/h and the maximum speed is 120 km/h. In general the consumption and range results produced by this cycle are considered very optimistic and with a serious divergence from the reality. This is the main reason that it has been replaced by the WLTP cycle.
 The NEDC cycle
WLTP cycle
The WLTP cycle (Worldwide Harmonized Light Vehicle Test Procedure) has been in use since September 2017 in Europe and replaces the NEDC cycle.
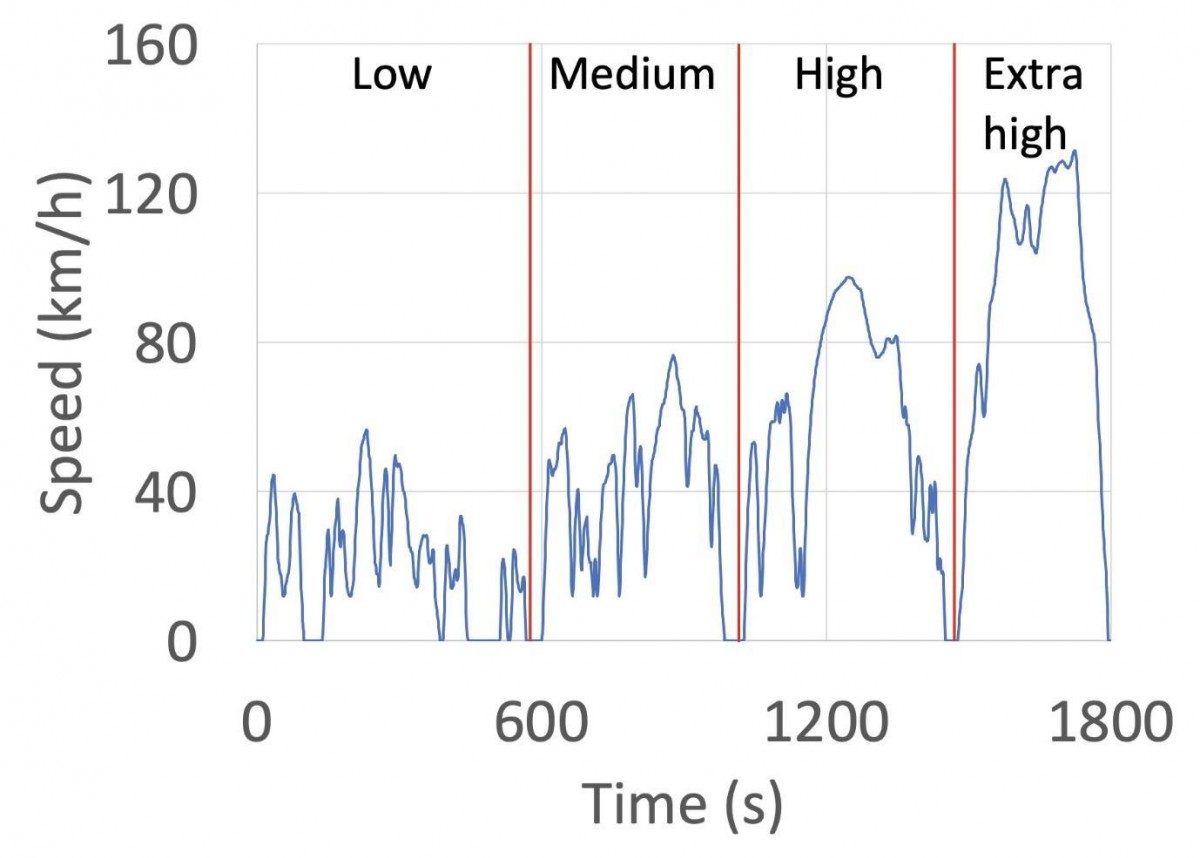
As in the NEDC setup and EPA, the test takes place in a lab as well. The WLTP cycle is divided into four parts based on different average speeds. These four parts are low, medium, high and extra high speeds. The total duration of the test is half an hour, the distance traveled is 23.25 km and the topology mix is 52% urban and 48% highway with an average speed of 46.5 km/h and maximum speed 131 km/h.
In contrast to the NEDC, WLTP takes into account the various equipment levels of the car and the tires/wheels combo. Especially the tires/wheels combo affects the consumption and range because of the alteration in aerodynamics and the bigger unsprung mass it presents depending on the wheel/tire size.
 The WLTP cycle
Which test cycle is more accurate?
There is not an obvious answer to this question because there are many different parameters at play in this difficult equation. Everyone's driving habits are different and so are their environments, so we can't realistically expect that any one test will be accurate for everyone. So the best we can hope for is a test that corresponds with real life performance that you can then multiply by your own personal coefficient and get an idea how long a certain car will go when you are at the wheel.
It is safe then that the NEDC cycle is the least accurate with results greatly varying from model to model and being of little use for comparing different vehicles. No wonder it was quickly retired then.
The WLTP and EPA cycles are closer to reality with the EPA cycle proving the less optimistic of the two. But at the end of the day it does feel like the WLTP cycle is the most consistent across different models and brands.
It has to be noted as well, that there are other cycles as well across the globe such as the Chinese CLTC which is closely related to the NEDC cycle. There is the IDC cycle which is used in India, and the JC08 cycle used in Japan, which uses very low speeds to determine emissions. In the table below, you can see the results for the same vehicle (VW e-golf) tested in the three major cycles.
| Model | Cycle | Range (km) | Power consumption (kWh/100km) |
|---|---|---|---|
| VW E-Golf | EPA | 190 | 17.5 |
| VW E-Golf | NEDC | 300 | 13.2 |
| VW E-Golf | WLTP | 231 | 15.8 |
Reader comments
- Anonymous
- rK8
Buyers and market is more mature now. People know and expect 10km/kwh approx for small cars and even lesser for bigger ones.


Facebook
Twitter
Instagram
RSS
Settings
Log in I forgot my password Sign up